
Industry data report. Updated October 9, 2026. Compiled by the TeddyPatches team from PPAI, U.S. Census, UN Comtrade and market-research data, plus our own price list.
Custom Patch Industry Statistics 2026: US Market Size, Imports and Pricing
The US patch market is worth an estimated $905.7 million. That number comes from a single research firm, and other published estimates disagree by a factor of 42. Here is everything that can be verified, what it means, and where the gaps are.
Key findings
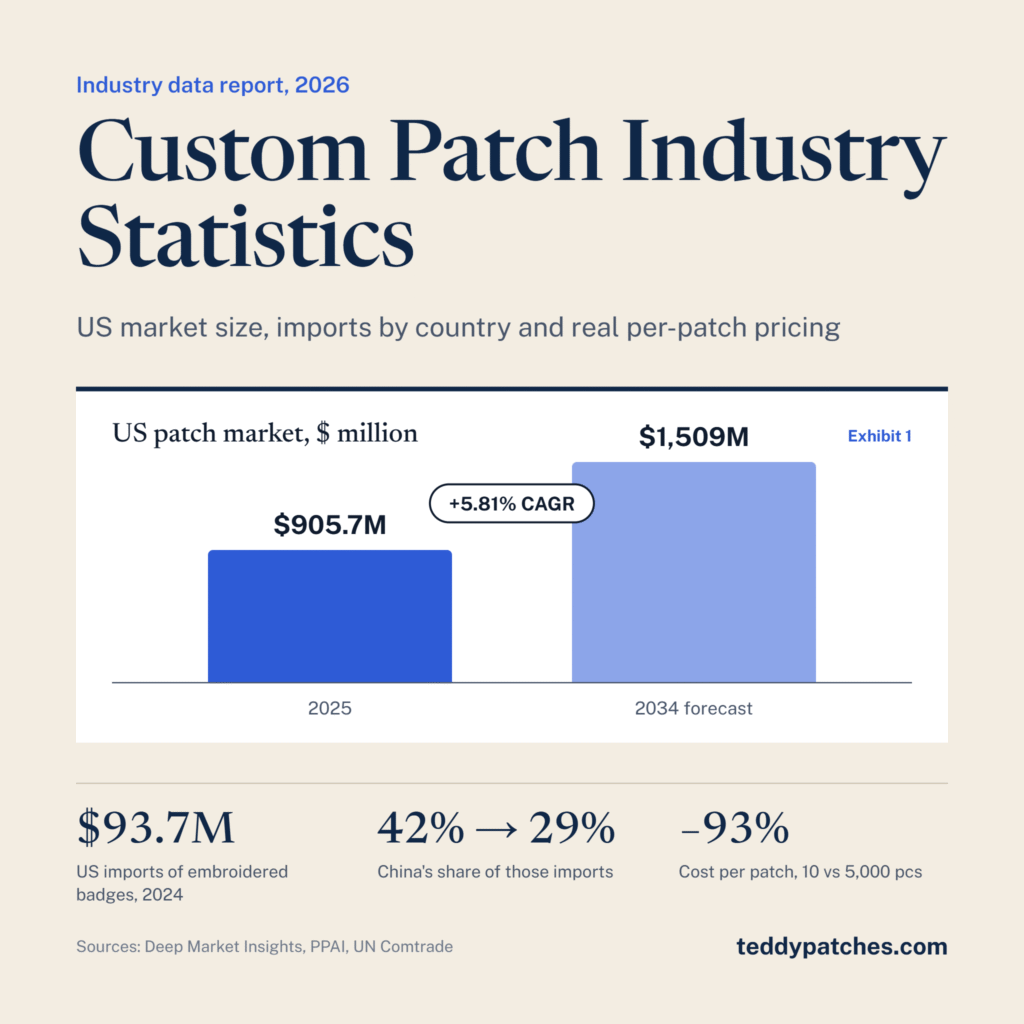
- The only dedicated US estimate puts the patch market at $905.7 million in 2025, rising to about $1.51 billion by 2034 at a 5.81% annual growth rate.
- Published patch-market estimates range from $100 million to $4.2 billion, because each firm defines "patches" and its geography differently.
- US promotional products distributors sold a record $27.13 billion in 2025, but growth slowed to 1.3%, below inflation.
- $23 billion of the $50 billion US promo market flows outside traditional distributors, through manufacturers, e-commerce sellers and artisans selling direct.
- US imports of embroidered badges, emblems and motifs (HS 581092) reached $93.7 million in 2024. Mexico's share has more than doubled since 2019 while China's fell from 42% to 29%.
- On our own price list, the cost per embroidered patch falls 93% between a 10-piece and a 5,000-piece order.
How big is the US custom patch market?
Deep Market Insights is the only research firm we found that publishes a dollar figure for the US patch market specifically. It values the market at $905.7 million in 2025 and forecasts $1.509 billion by 2034, a compound annual growth rate of 5.81% over 2026 to 2034. That adds about $603 million in annual sales over the period.
The same firm puts the global patch market at $4.2 billion in 2025, which makes the US 21.56% of global demand. Embroidered patches are the largest segment, at a published $409.74 million, or about 45% of the US total by our calculation.
Exhibit 1
US patch sales are forecast to grow by about two thirds over the next nine years
US patches market, $ million
Treat this as a vendor estimate rather than an official statistic. No government agency measures patch sales directly, and the firm does not explain how it built the number. Every segment it lists is decorative (embroidered, printed, iron-on; fashion, military, sports), so the figure should exclude medical and transdermal patches, but the page never says so outright.
Why patch market estimates disagree by 42 times
Search for "patch market size" and you will find numbers that cannot all be true. We collected every estimate we could verify on the publisher's own page. They split into three different markets that happen to share a name.
Exhibit 2
Published patch-market estimates span from about $100 million to $4.2 billion
Headline market estimate by publisher, $ million, log scale
Show the data
| Publisher | Scope | Year | Estimate ($M) |
|---|---|---|---|
| TechSci Research | Global, embroidered badges & patches | 2023 | 99.9 |
| Verified Market Research | Global, embroidered badges & patches | 2024 | 100.2 |
| Deep Market Insights | United States, all patches | 2025 | 905.7 |
| Intel Market Research | Global, iron-on patches | 2025 | 1,150.0 |
| Business Research Insights | Global, embroidered badges & patches | 2026 | 1,380.0 |
| Deep Market Insights | Global, all patches | 2025 | 4,200.0 |
Three things drive the gap. First, scope: "embroidered badges and patches" is a narrow slice, while "patches" can include printed, woven, PVC and chenille. Second, backing is not a product type, so an "iron-on patches" report overlaps with all the others. Third, geography and base year vary.
If you are citing a patch market figure, name the publisher, the year and the scope in the same sentence. A bare "the patch market is worth $X billion" is almost always comparing different things.
Patches compete inside a $50 billion promotional products market
Most custom patch orders are paid for out of the same budgets as branded hats, shirts and bags. That puts patches inside the promotional products industry, which is measured far more carefully than patches alone.
Research by PPAI and Oxford Economics, published in September 2026, estimates that Americans spent $174 billion on branded merchandise in 2025. About $50 billion of that was promotional products and $124 billion was licensed merchandise such as sports and entertainment goods.
Exhibit 3
The patch market is about half of one percent of US branded merchandise spending
Market size, $ billion, 2025; square area is proportional to value
Distributor sales hit a record, but growth stalled
The traditional distributor channel sold $27.13 billion of promotional products in 2025, its first year above $27 billion. Growth slowed to 1.3%. Sales fell 19% in 2020 and have recovered 38% since.
Exhibit 4
Promo distributor sales recovered 38% from the 2020 low, but 2025 growth slowed to 1.3%
US promotional products distributor sales, $ billion
Show the data
| Year | Sales ($B) | Change |
|---|---|---|
| 2018 | 24.75 | |
| 2019 | 24.22 | -2.1% |
| 2020 | 19.62 | -19.0% |
| 2021 | 22.08 | +12.5% |
| 2022 | 25.52 | +15.6% |
| 2023 | 26.09 | +2.2% |
| 2024 | 26.78 | +2.6% |
| 2025 | 27.13 | +1.3% |
The slowdown is about margins as much as volume. PPAI's market economist summed up 2025 by saying many distributors "sold more but made less," pointing to tariff swings, compliance and freight costs, and tighter client budgets. A PPAI flash survey of the 100 largest firms found revenue up just 0.7% in July and August 2025, against 2.9% inflation.
Where the $50 billion actually flows
PPAI's $50 billion figure is broader than the distributor channel. It also counts manufacturers and suppliers selling direct, third-party e-commerce, artisan producers and blank goods bought for in-house decoration. Direct-to-buyer patch makers sit in those channels, not in the $27 billion distributor number.
Exhibit 5
Nearly half of US promo spending, about $23 billion, bypasses traditional distributors
US promotional products market by channel, $ billion, 2025 (illustrative split)
of 2025 distributor sales were transacted online, $7.1 billion, up from 25.5% ($6.83 billion) in 2024. Online sales jumped 35.85% in 2024 alone.
of 2025 distributor sales were sustainable products, $3.8 billion, up from $3.69 billion in 2024. PPAI says growth in this category slowed.
Wearables are where most patches end up. In PPAI's 2024 data, apparel was the largest product category at 26.6% of distributor sales, with caps and hats at 9.0%. PPAI and ASI do not break out sales by decoration method, so there is no published figure for how much of that apparel carries a patch versus direct embroidery or print.
Where America's patches come from
Trade data is the closest thing to a hard, government-reported number for patches. US customs reports imports under HS 581092, which covers embroidery of man-made fibers in motifs and strips and includes the tariff line for badges, emblems and motifs (HTS 5810.92.10).
Imports were $93.7 million in 2024, up 58% from the 2020 low and about 12% above 2019. The bigger story is the shift in suppliers.
Exhibit 6
China's share of US embroidered badge imports fell from 42% to 29% as Mexico's more than doubled
US imports of HS 581092 by source country, $ million
Show the data
| Year | Total ($M) | China ($M) | China share | Mexico ($M) | Mexico share | All other ($M) |
|---|---|---|---|---|---|---|
| 2019 | 83.4 | 35.1 | 42% | 10.1 | 12% | 38.2 |
| 2020 | 59.2 | 18.6 | 31% | 9.6 | 16% | 31.0 |
| 2021 | 80.5 | 23.3 | 29% | 16.4 | 20% | 40.8 |
| 2022 | 95.3 | 31.5 | 33% | 15.5 | 16% | 48.3 |
| 2023 | 94.4 | 29.3 | 31% | 20.3 | 22% | 44.8 |
| 2024 | 93.7 | 27.4 | 29% | 24.9 | 27% | 41.4 |
In 2024 the top suppliers after China ($27.4M) and Mexico ($24.9M) were "Other Asia," which in UN data mostly means Taiwan ($12.3M), Thailand ($10.1M) and India ($7.7M). Vietnam grew from $0.1 million in 2019 to $2.1 million.
Woven patches and labels are reported separately under HS 580710. Those imports reached $37.6 million in 2024, led by Mexico ($16.1M) and China ($11.0M).
Who makes and sells patches in the US
The industry is made up of small firms. No government category covers patches alone. Embroidery contractors and fabric badge makers are classified under NAICS 314999, All Other Miscellaneous Textile Product Mills, whose index lists "badges, fabric, manufacturing" and "embroidering contractors on apparel." (Some articles cite NAICS 33992, which is sporting goods manufacturing and does not apply.)
| Segment | Businesses | Employees | Note |
|---|---|---|---|
| Promotional products companies (all types) | Nearly 40,000 | n/a | About 98% are small businesses with under $2.5M in sales (PPAI) |
| Commercial screen printing, NAICS 323113 | 5,854 | 70,664 | Census County Business Patterns 2023 |
| Misc. textile product mills, NAICS 314999 | 2,241 | 26,500 | CBP 2023; includes embroidery but also unrelated textile goods |
| Commercial embroidery services | 943 | 7,751 | IBISWorld: $987.4M revenue in 2026, flat for five years; no firm holds over 5% |
Census figures as compiled by Vanta Insights from County Business Patterns 2023. Smaller distributors made $12.4 billion, or 46%, of 2024 promo sales (PPAI).
Fragmentation is good news for specialists. When no firm holds more than 5% of contract embroidery, a supplier can compete on a narrow niche, such as motorcycle club back patches or PVC tactical patches, rather than on breadth. PPAI's outlook survey points the same way: 65.8% of suppliers and almost 77% of distributors named new customer segments as their biggest growth opportunity for 2025.
What custom patches cost per piece
Market reports rarely show what buyers actually pay. Here are the per-piece prices from our own published price list, so you can see how quantity changes the math.
Exhibit 7
Per-piece cost falls about 93% from a 10-piece order to a 5,000-piece order
TeddyPatches list price per patch, $, by order quantity (log scale)
Show the data
| Quantity | Embroidered, per piece | PVC, per piece |
|---|---|---|
| 10 | $12.50 | $12.50 |
| 50 | $3.50 | n/a |
| 100 | $2.49 | $3.49 |
| 500 | n/a | $1.20 |
| 1,000 | $1.20 | $1.20 |
| 5,000 | $0.85 | $0.75 |
The fixed costs of a custom patch, digitizing the artwork or cutting the PVC mold, plus setup and a physical sample, are the same for 10 pieces as for 5,000. That is why the curve drops steeply up to about 100 pieces and then flattens. At 100 pieces, embroidered patches are the cheaper option ($2.49 vs $3.49). At 5,000, PVC patches edge ahead ($0.75 vs $0.85).
How a custom PVC patch order moves through our shop
- Payment, then a digital mockup for approval.
- We cut the mold and make a physical sample, then send a video proof.
- Production starts only after the sample is approved.
- A 5,000-piece run takes about 7 days of production, then about 4 business days in transit to the US. Each patch ships in its own poly bag.
Custom apparel demand gives patches a tailwind
Patches ride on wider demand for personalized clothing. Grand View Research valued the US custom T-shirt printing market at $857.5 million in 2023 and expects $1.85 billion by 2030, an 11.8% annual growth rate. That is a separate market, but the buyers overlap: teams, clubs, small brands and companies ordering short runs online.
What the numbers mean for patch buyers and sellers
The data supports steady growth, not a boom. The dedicated forecast implies under 6% a year, the promo channel grew 1.3% in 2025, and contract embroidery revenue has been flat for five years. Within that, three shifts stand out.
Direct ordering is winning share. About $23 billion of promo spending already bypasses distributors, and online sales keep rising. Buyers who order straight from a manufacturer skip a layer of markup.
Sourcing is moving. Mexico, Thailand and Vietnam gained ground on China in embroidered badge imports between 2019 and 2024, a period of rising tariffs on Chinese goods.
Quantity matters more than unit price. Because setup is fixed, moving from 50 to 100 pieces cuts the per-piece cost of an embroidered patch by about 29%. If you will reorder, a larger first run usually pays off. Request a quote with your size and quantity to see the exact break points.
How we compiled these statistics
We checked every figure on this page against the publisher's own page or report in October 2026, rather than relying on secondary summaries. Where we calculated a share or growth rate ourselves, the exhibit says so.
A few limits are worth knowing. Market-research firms do not publish their methods, and several of their pages contradict themselves. Census establishment counts were taken from Vanta Insights' compilation of County Business Patterns 2023, because census.gov was not reachable from our research tools; we will re-check them against data.census.gov. Trade codes capture imports only, not domestic production or patches already sewn onto garments. We dropped one claim that circulates widely, about embroidery trends in ASI's 2025 apparel outlook, because we could not find it in the source.
Frequently asked questions
How big is the custom patch industry in the US?
The only dedicated estimate, from Deep Market Insights, values the US patch market at $905.7 million in 2025 and forecasts about $1.51 billion by 2034. Patches also compete for budget inside a $50 billion US promotional products market.
Is the patch market growing?
Yes, but slowly. The patch forecast implies 5.81% a year from 2026 to 2034. The wider promo distributor channel grew 1.3% in 2025, and US contract embroidery revenue has been roughly flat for five years.
Where are most custom patches imported from?
China is still the largest source of US imports of embroidered badges, emblems and motifs (HS 581092), at $27.4 million in 2024, but its share fell from 42% in 2019 to 29%. Mexico rose to $24.9 million, or 27%.
What is the HS code for embroidered patches?
Embroidered badges, emblems and motifs of man-made fibers are classified under HTS 5810.92.10, within HS subheading 581092. Woven badges and labels fall under HS 580710.
What NAICS code covers embroidery and patch making?
NAICS 314999, All Other Miscellaneous Textile Product Mills. Its index includes fabric badge manufacturing and embroidering contractors on apparel. NAICS 33992 is sporting goods and does not apply.
How much do custom patches cost per piece?
On our October 2026 price list, an embroidered patch up to 3 inches costs $12.50 each at 10 pieces, $2.49 at 100 and $0.85 at 5,000. PVC patches under 3 inches run $12.50 at 10 pieces (plus mold), $3.49 at 100 and $0.75 at 5,000.
Are embroidered or PVC patches cheaper?
At small and mid quantities embroidered patches usually cost less, for example $2.49 vs $3.49 each at 100 pieces on our list. At 5,000 pieces PVC becomes slightly cheaper, $0.75 vs $0.85.
Cite this page
Journalists, students and other sites are welcome to use these figures and exhibits with a link back to this page.
TeddyPatches. (2026, October 9). Custom patch industry statistics 2026: US market size, imports and pricing. https://teddypatches.com/blogs/custom-patch-industry-statistics-usa/
Sources
- Deep Market Insights, United States Patches Market Size & Outlook 2026–2034 (updated Apr 2, 2026). https://deepmarketinsights.com/vista/insights/patches-market/united-states
- Deep Market Insights, Global Patches Market (updated May 15, 2026). https://deepmarketinsights.com/vista/insights/patches-market/global
- TechSci Research, Embroidered Badges and Patches Market. https://www.techsciresearch.com/news/18423-embroidered-badges-and-patches-market.html
- Verified Market Research, Embroidered Badges and Patches Market. https://www.verifiedmarketresearch.com/product/embroidered-badges-and-patches-market/
- Business Research Insights, Embroidered Badges and Patches Market. https://www.businessresearchinsights.com/market-reports/embroidered-badges-and-patches-market-119008
- Intel Market Research, Iron-on Patches Market. https://www.intelmarketresearch.com/iron-on-patches-market-44205
- PPAI and Oxford Economics, Inside the $174 billion U.S. branded merchandise market (Sep 22, 2026). https://www.ppai.org/media-hub/inside-the-174-billion-us-branded-merchandise-market/
- PPAI Magazine, March 2026: 2025 U.S. Distributor Sales Volume Estimate, p. 38. https://flipbook.ppai.org/2026-03-01/38
- PPAI, U.S. distributor sales reached new height in 2025 but hampered by volatility (Jan 12, 2026). https://www.ppai.org/media-hub/ppai-research-u-s-distributor-sales-reached-new-height-in-2025-but-hampered-by-volatility/
- PPAI Research, Promo's slight growth faces external pressures (Sep 24, 2025). https://www.ppai.org/media-hub/ppai-research-promos-slight-growth-faces-external-pressures/
- PPAI, 2024 Sales Volume Report (PDF). https://www.ppai.org/wp-content/uploads/2025/02/2024-PPAI-Sales-Volume-Report.pdf
- PPAI, LEAD 2025: How promo advances the U.S. economy (Mar 18, 2025). https://www.ppai.org/media-hub/lead-2025-how-promo-advances-the-us-economy/
- PPAI, Outlook 2025: Promo firms expect sales growth (Dec 31, 2024). https://www.ppai.org/media-hub/outlook-2025-promo-firms-expect-sales-growth/
- World Bank WITS / UN Comtrade, U.S. imports of HS 581092 by partner, 2019–2024. https://wits.worldbank.org/trade/comtrade/en/country/USA/year/2024/tradeflow/Imports/partner/ALL/product/581092
- World Bank WITS / UN Comtrade, U.S. imports of HS 580710, 2024. https://wits.worldbank.org/trade/comtrade/en/country/USA/year/2024/tradeflow/Imports/partner/ALL/product/580710
- NAICS 2022 code 314999 description and index entries (Census definitions as published by NAICS Association). https://www.naics.com/naics-code-description/?v=2022&code=314999
- U.S. Census County Business Patterns 2023, NAICS 323113, as compiled by Vanta Insights. https://vantainsights.com/industry/323113-commercial-screen-printing
- U.S. Census County Business Patterns 2023, NAICS 314999, as compiled by Vanta Insights. https://vantainsights.com/industry/314999-all-other-miscellaneous-textile-product-mills
- IBISWorld, Commercial Embroidery Services in the US (2026). https://www.ibisworld.com/united-states/industry/commercial-embroidery-services/5325/
- Grand View Research, U.S. Custom T-shirt Printing Market. https://www.grandviewresearch.com/industry-analysis/us-custom-t-shirt-printing-market-report
- TeddyPatches published price list, October 2026. https://teddypatches.com/